Performance of Long-only Model Portfolio Driven Exclusively by VIXEK™
While the performance of "IRA Portfolio" is noteworthy, its success is in part due to the success of picking the right stocks - i.e picking more winners than losers. VIXEK™ was helpful in anticipating major downturns and upturns to adjust the portfolio.
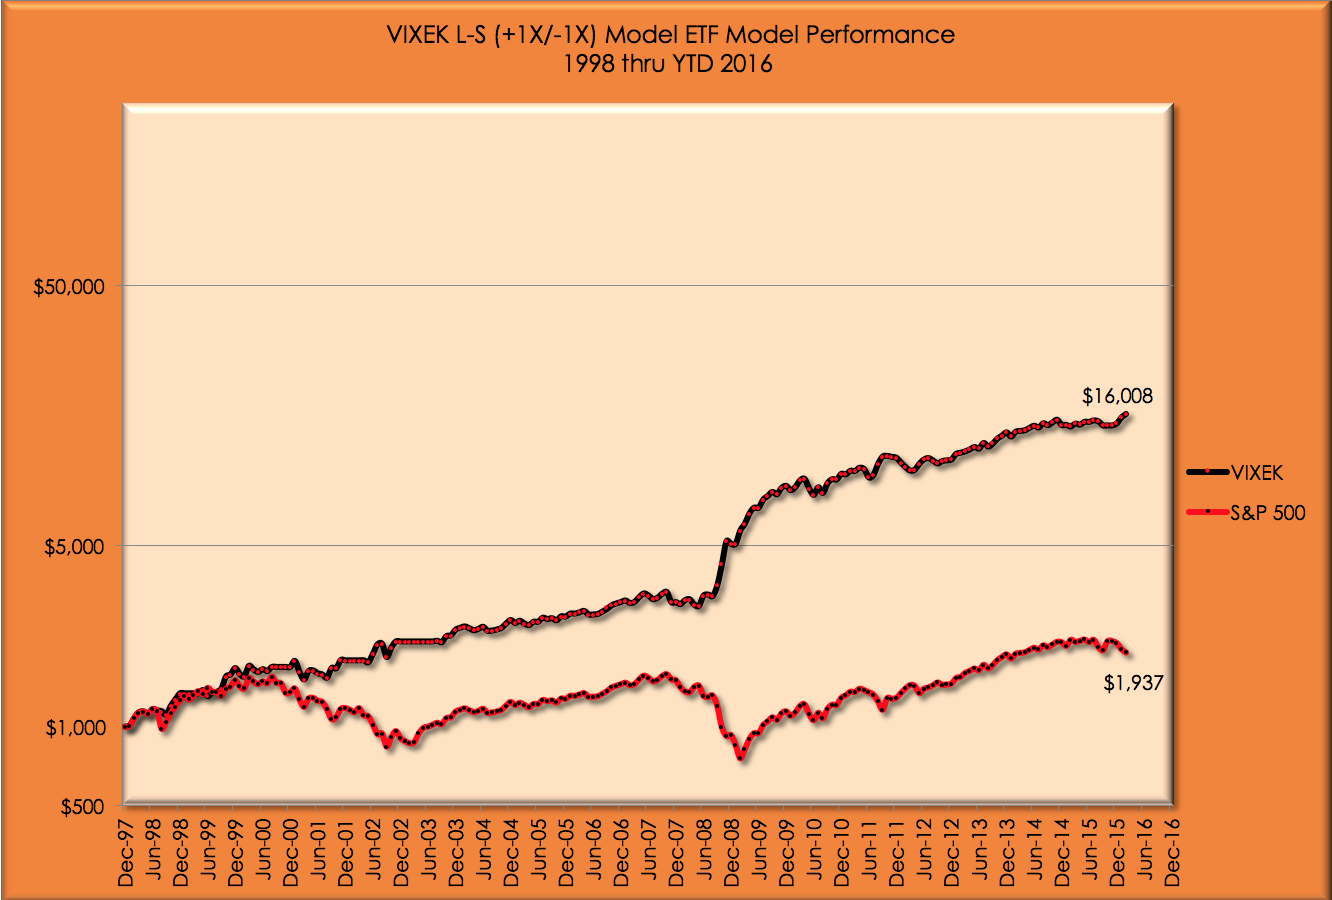
To showcase the full power of VIXEK™ exclusively and to parse out any beta benefits from stock-picking, we created a hypothectical model portfolio consisting of a portfolio of long and short, unleveraged ETFs indexed to S&P 500.
In this portfolio, we started on January 1, 1998 with 95% of our funds invested in an S&P 500 index ETF at the closing price of the previous trading day (12/31/1997).
Depending entirely and exclusively only on the latest VIXEK™ indicator, this model adjusts its position rangind between 1X long and -1X short, and everything in between including being in cash.
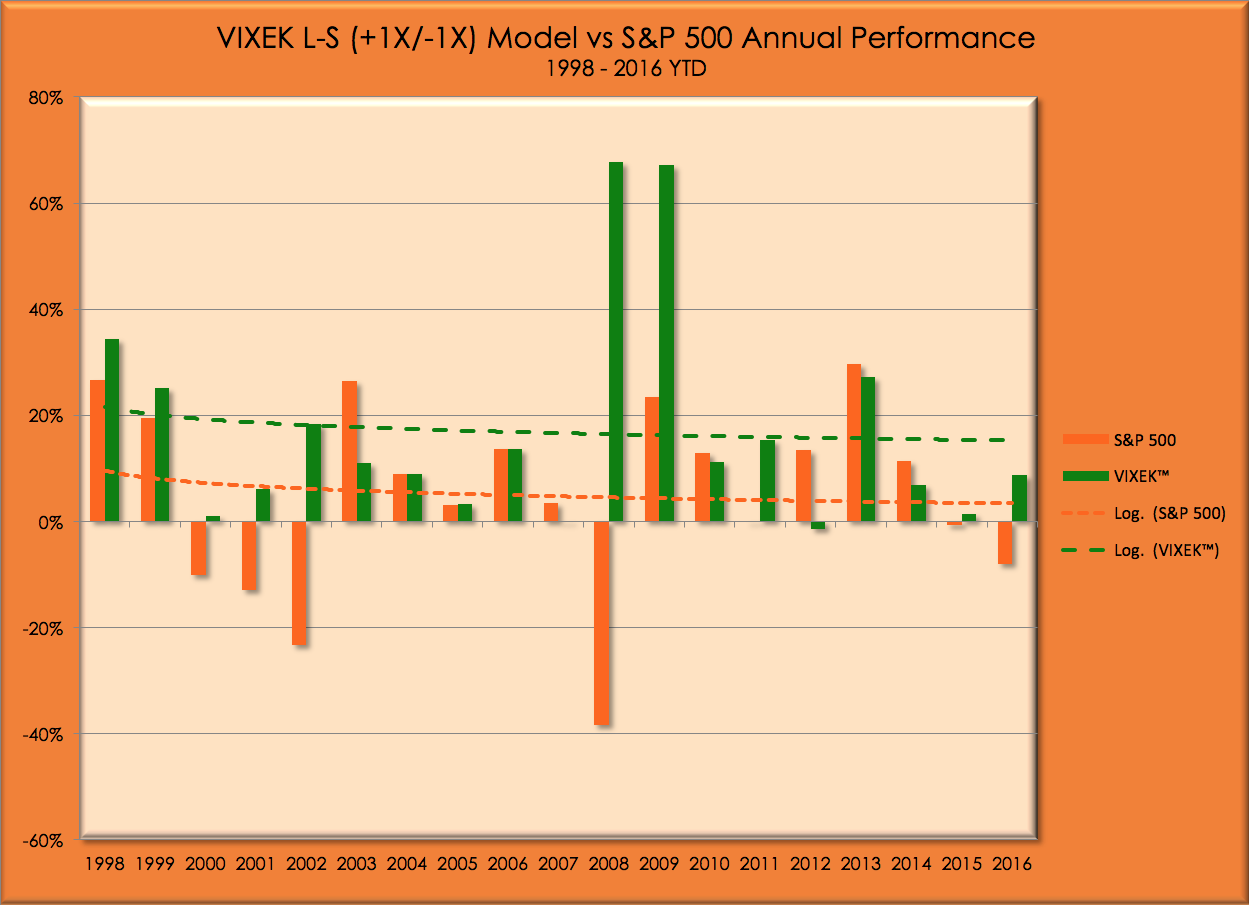
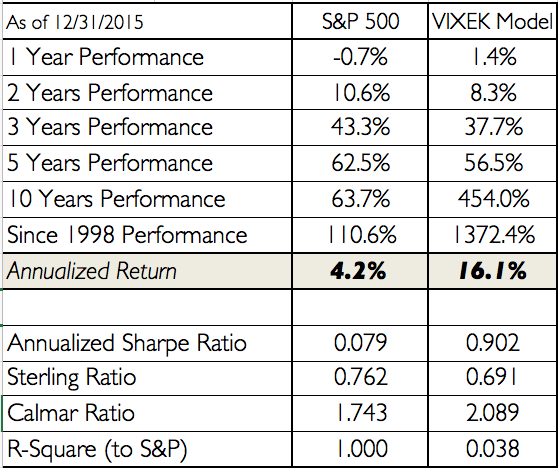
The performance of this model portfolio is shown below.
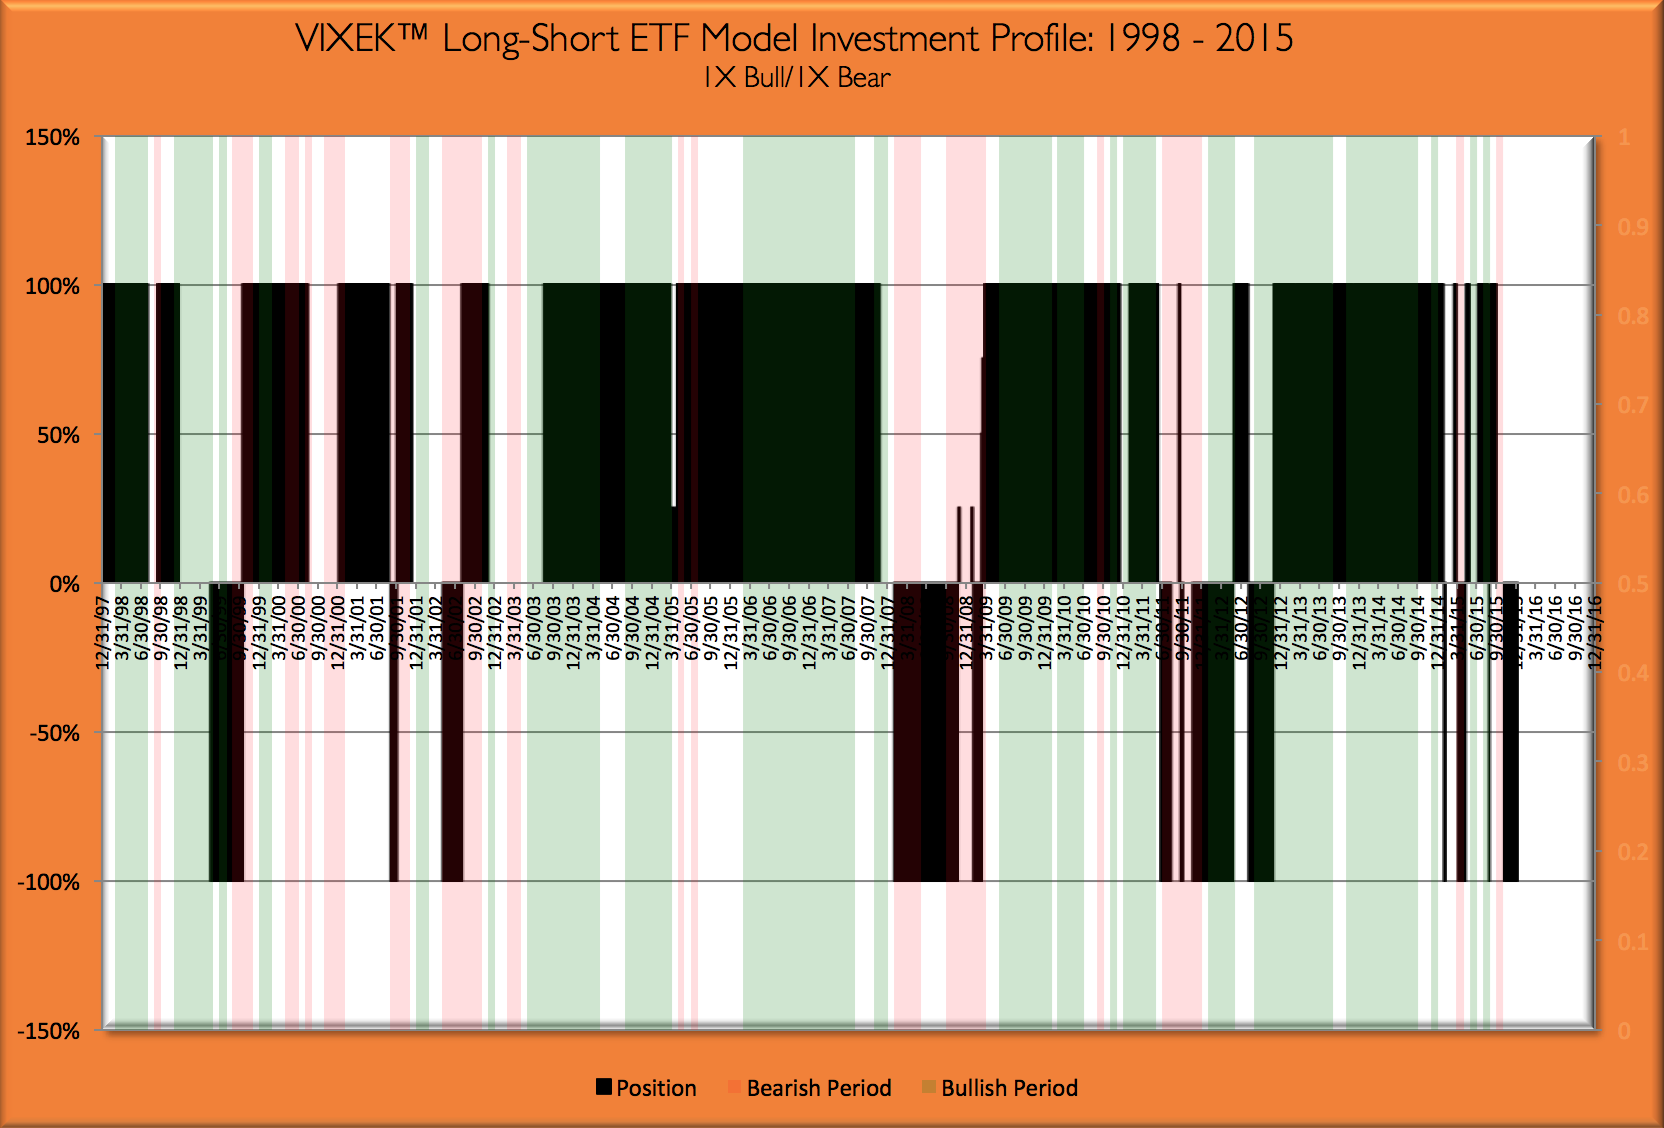
Dark bands above the zero line represent bullish investments. Light green bands represent bullish periods; light red bands represent bearish periods.
DISCLAIMER:
All performance data above is for a hypothetical Long-Short (+1X/-1X) fund designed to simulate an actual fund investing in unleveraged ETFs and all reported results are before any transaction, management and performance fees.
Also, as is always the case, past performance is not a guarantee of future performance of similar or any other portfolio.